Demographics and Housing
Livable Built Environment:
Demographics and Housing
As compared to housing prices in surrounding municipalities and the County as a whole, housing prices in much of New Castle are relatively high. Between 2007 and 2016, median sales prices for homes in New Castle were, on average, $245,030 higher than median sales prices for all homes in Westchester County. In 2016, the median sale price for a home in New Castle was $850,500, whereas the County’s median sales price was $623,350. Rental costs in the Town and County show a similar trend.
The predominance of high-cost, single-family housing and the limited supply of alternative housing types continue to pose challenges for certain demographic groups in the community. Empty-nesters, retirees and seniors who would like to stay in the community and “age in place,” but do not have the physical or financial means to maintain a single-family home, have relatively few alternative and/or affordable housing options in New Castle. Despite their desire to remain in the community, and as children graduate from the school system, longtime residents tend to move to other communities with more housing options and amenities, such as alternative transportation options which do not require ownership of a personal vehicle, despite their desire to remain in the Town. The high cost of housing as well as the lack of alternative housing types also makes it difficult for young and single-income families and individuals employed within the Town and millennials (those age 18 – 33 years) in general to live in the community. Much of this has been evidenced through the population and demographic condition of the community.
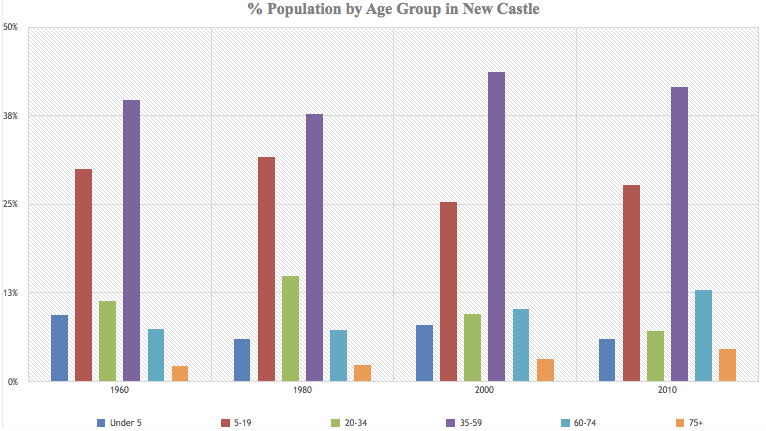
While New Castle’s population has grown (quickly in the 1950s and ‘60s, and then more gradually into the 21st century), the age distribution of the Town’s population has generally remained consistent through the decades as reflected in Figure 1. Since the 1950s, New Castle’s population has been composed mainly of families with school-age children. Those between the ages of 5 and 19 have made up 25 – 30% of the population, while people ages 35 to 59 have consistently comprised 38 – 44%. Figure 1 also reflects a slight trend amongst those between the ages of 20 and 34 and those over 60 which indicates that as couples have chosen to have children later in life and the baby boomer population (ages 60 – 74) has aged, people between the ages of 20 and 34 have comprised a smaller percentage of the Town’s population than ever before, while the percentage represented by those between the ages of 60 and 74 has increased.
New Castle’s age distribution through the years reveals a few key trends. First, it is likely that families with school-age children will continue to make up a considerable portion of New Castle’s population and will be served by the existing single-family housing stock within the Town. Second, the senior population, those age 60 or above, will continue to increase as the baby boomer generation ages, notwithstanding the trend of outmigration for those whose children have graduated from the school system. The reduction in the percentage of those between age 18 – 33 (millennials) appears to be consistent with national trends of re-urbanization whereby young people are moving from the suburbs to the city and are becoming less reliant on the private automobile.